Local rank grid tracking: what the map shows, and what it does not
How a local rank grid works, how to choose the grid size and spacing, how to read the heatmap, and the mistakes that make a grid scan misleading.
Local rank grid tracking checks where a business appears in the map results from many points around it, instead of from one. Ask "where do we rank for emergency dentist?" and the honest answer is "it depends where the patient is standing". A grid turns that answer into a picture: a lattice of positions over the town, strong in some places and missing in others.
It is the most persuasive local SEO measurement there is, and also one of the easiest to get wrong. This guide covers how it works, how to set one up, and how to read it without fooling yourself or the owner.
Why a single rank check misleads
Google says local results depend on three things: relevance, distance and prominence. Distance is the one that makes a single check unreliable. The same search, run from the shop's front door and from a street two kilometres away, can return a completely different map pack.
So a business that checks its ranking from its own office will usually see itself near the top, and conclude everything is fine. Its customers, searching from home, may not see it at all.
How a grid scan works
Pick a centre. Usually the business's own location.
Lay a grid over it. An odd number of points in each direction, so one point sits on the business: 3×3, 5×5, 7×7 and so on.
Choose the spacing. The distance between neighbouring points, in metres or miles.
Run the search from every point. The same keyword, as if a customer were standing there, recording the business's position in the map results at each point.
Colour the result. Each cell shows the position, usually green for the top three, amber for the rest of the first page, and red or empty where the business does not appear.
The spacing and the grid size together set the area covered. A 5×5 grid at 800 metres spans 3.2 km from edge to edge; a 7×7 grid at 500 metres spans 3 km with more detail.
Choosing the size and spacing
Match the grid to how far customers actually travel, not to how big you would like the business to be.
Business | Typical customer journey | A sensible starting grid |
|---|---|---|
Café or takeaway in a city | A few streets | 5×5 at 250 to 400 m |
Dentist or physiotherapist | A neighbourhood or two | 5×5 or 7×7 at 500 to 800 m |
Plumber, electrician or roofer | The whole service area | 7×7 at 1 to 2 km |
Rural trade business | Several villages | 5×5 at 2 to 4 km |
Too tight, and every cell is green because you have only measured the street outside. Too wide, and every edge cell is red because no business ranks forty kilometres from its door. Both tell the owner nothing.
What the numbers mean
Most grid tools report some version of these:
Average position across all cells. Useful as a trend, misleading on its own, because one strong centre and a ring of empty cells can average out to "fine".
Top-three share: the share of cells where the business is in the map pack. This is the number closest to "how often would a nearby customer see us without scrolling".
Share of local voice: how the top positions across the grid are split between the business and its rivals. Definitions differ between tools, so compare like with like.
The rival in each cell where the business is missing. This is often the most useful output of all, because it tells the owner who is taking the work.
Reading the heatmap
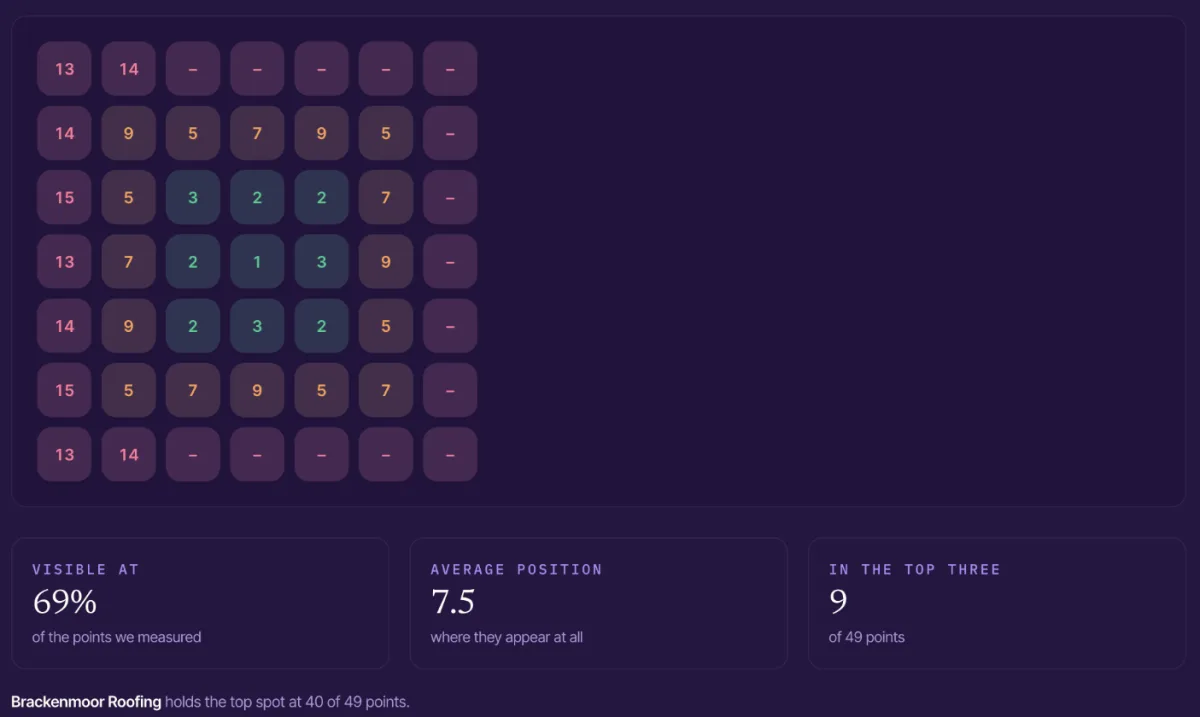
A 7×7 grid at 800 metres for "roofer leeds", from SiteAssay's demo workspace. The business is first at its own address, visible at 69% of points, and in the top three at only 9 of 49. One rival holds the top spot at 40 of them.
A few patterns come up again and again. The grid above shows the first one, and a little of the second: the business is far stronger to the west of its address than to the east.
Strong centre, empty edges. The normal shape for a business with a decent profile and little else. Proximity is doing all the work. The fix is prominence: reviews, links, local content, a website that names the areas served.
Strong off-centre. The business ranks well somewhere other than its address. Often the listing's pin is in the wrong place, or the business is strong in one suburb because of where its reviews come from.
Weak everywhere, including the centre. A relevance problem. Check the primary category, the business name and whether the website mentions the service at all.
One rival in every red cell. A single competitor dominating the area. Look at what that rival's profile and site do that this one does not.
Mistakes that make a grid misleading
The wrong keyword. Track what customers type ("dentist near me", "emergency dentist"), not the business's own name or its internal service labels.
A partial scan. If some points fail, a grid with empty cells reads as "you do not appear here" when the truth is "we did not measure here". Never show a partial grid to an owner as if it were complete.
Comparing grids with different settings. A 5×5 at 500 m and a 7×7 at 1 km are different measurements. Re-run the exact same grid when you report progress.
Treating one scan as the truth. Map results move from day to day. One grid is a snapshot; two or three over a few weeks show the shape.
Using a grid with a business owner
Owners understand a map of their own town instantly. Show the grid for their most important search, point to the street they know they get work from, and point to the one where they disappear. Then show who appears instead.
Pair it with the rest of the local SEO audit: the profile, the reviews and the website signals behind the ranking. The grid shows the problem; the audit explains it. Three months later, run the same grid again. Because it is the same measurement, the before and after is a fair comparison, and it is the clearest proof of local SEO work you can give. The dentist playbook shows how this fits a practice that competes street by street.
How SiteAssay's Local Grid works
The Local Grid checks the map results at every point of an odd-sized grid centred on the business, spaced in metres you choose, and records a rank in every cell. It reports how often the business makes the top three, its share of local voice, and the rival that takes each place it loses.
Two rules keep it honest. A grid that stopped part way is shown to you and never to the business, because the empty half would read as nowhere. And nothing runs in the background, so a grid only runs when you ask for one. The methodology page explains how each measurement is taken.
It works for businesses with no website too, which makes it a useful first look at businesses you have found with SiteAssay's search.
Questions
What is a local rank grid?
A set of map-ranking checks run from evenly spaced points around a business, showing its position in the local results at each point. It shows where nearby customers can find the business and where they cannot.
What grid size should I use?
Start from how far customers travel. A 5×5 or 7×7 grid covering the real service area is enough for most local businesses; a larger grid mostly adds empty edge cells.
How often should I run a grid scan?
Monthly is enough for reporting, using exactly the same keyword, size and spacing each time. Run a fresh one after a significant change, such as a new category or a site relaunch.
Is a local rank grid accurate?
It is a good estimate of what a searcher at each point would see, not a guarantee. Results change with time, device and the searcher's history, so look at the pattern rather than any single cell.
Written by
SiteAssay